

Advertisement

- Updated on August 26, 2026
- IST 2:54 pm
Asked to score the government out of ten on how it is handling rising petrol prices, India came back with 4.2.
Not a catastrophe. Not a pass either. And underneath that single number is a distribution far more lopsided than the average suggests.
PolBol’s Hindsight poll put one question to 3,930 OTP-verified respondents: how much would you rate the current government in subsidising the rising petrol prices in the current economic turmoil? Scores ran from 1 to 10, where 10 is the highest.
Nobody rated it well
Here is the finding that survives every caveat in the study.
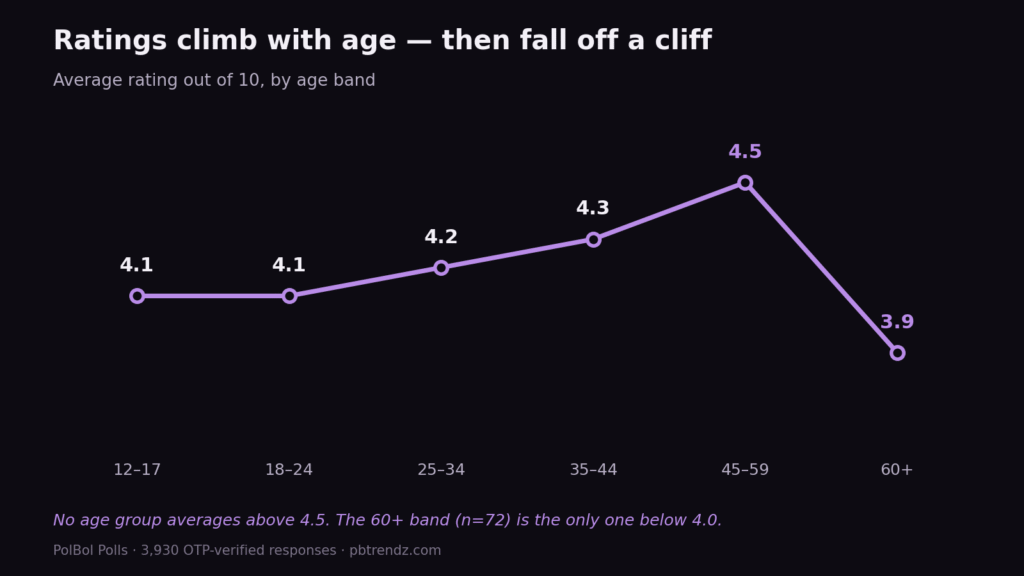
No age group averaged above 4.5 out of 10. Not the most generous band, not any subgroup, not men or women. The full range across six age bands runs from 3.9 to 4.5 — a spread of 0.6 points on a 10-point scale.
India’s respondents disagree about a great many things in these Hindsight polls. On this one, the disagreement is about how far below the halfway mark to place the answer.
The number under the number
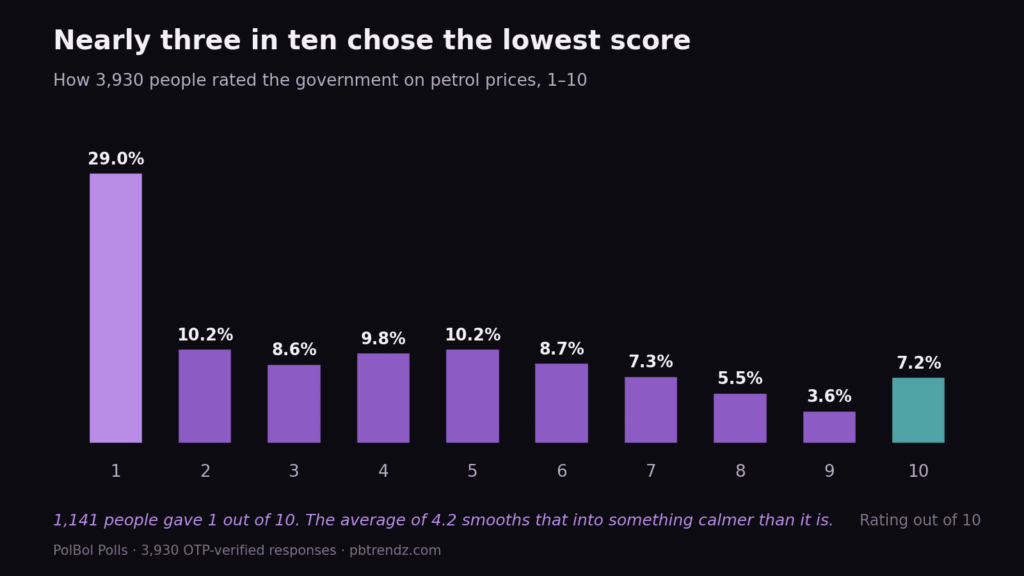
Averages hide shapes. This one hides a big one.
1,141 people — 29.0 per cent of everyone who answered — gave the lowest possible score of 1 out of 10. That is nearly three in ten respondents choosing the floor. No other score comes close: the next largest blocks are 5 out of 10 (400 votes, 10.2 per cent) and 2 out of 10 (402 votes, 10.2 per cent).
At the other end, 281 people — 7.2 per cent — gave a perfect 10.
So the 4.2 average is not describing a country that mildly disapproves. It is describing a country with a large bloc at the bottom, a thin middle, and a small committed group at the top. Averages smooth that into something calmer than it is.
Ratings climb with age — then fall off a cliff
The clearest pattern in the study is generational, and it runs in one direction almost all the way up.
12 to 17-year-olds: 4.1. Nearly a third of them — 30.9 per cent — gave a 1.
18 to 24-year-olds: 4.1. The largest group in the sample by far, at 2,429 respondents. 29.6 per cent gave a 1.
25 to 34-year-olds: 4.2.
35 to 44-year-olds: 4.3. The share giving a 1 drops to 25.0 per cent, and 36.2 per cent rate it 6 or higher.
45 to 59-year-olds: 4.5. The most generous group in the poll — the lowest share of 1-out-of-10 ratings anywhere at 22.0 per cent, and 38.5 per cent rating 6 or above.
60 and above: 3.9. The only average below 4.0.
Four steps up, then a sharp step down. Middle-aged India is the government’s best audience on this question. The two youngest groups and the oldest are its harshest.
Men and women give the same score for different reasons
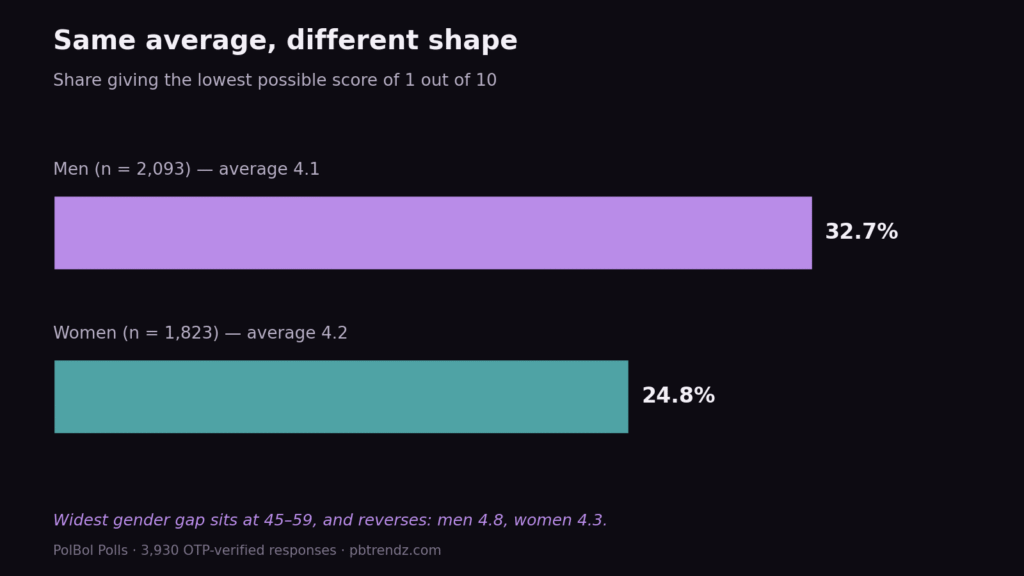
The averages are almost identical — men 4.1, women 4.2 — but they are built differently.
32.7 per cent of men gave a 1 out of 10. Among women it was 24.8 per cent. Men are markedly likelier to reach for the floor.
Women cluster closer to the middle: 12.2 per cent rated it 2, and 11.8 per cent rated it 5.
The widest gender gap sits in the 45 to 59 band, and it runs the other way from what the overall figures suggest — men in that group average 4.8, women 4.3.
Same headline number, two different distributions. It is a useful reminder that a gender gap in an average can be zero while the underlying disagreement is real.
The oldest group is the toughest — with a caveat
Among respondents aged 60 and above, 34.7 per cent gave the lowest possible score. More than one in three. It is the harshest verdict of any age band in the study, and the only average that dips below 4.
PolBol flags the limit, and so should we: that group contains 72 respondents. A dozen different answers would move those shares noticeably. Read the direction, not the decimal.
How to read this
Two limits, stated plainly.
The sample skews heavily young: 18 to 24-year-olds make up 61.8 per cent of everyone who answered. That is the demographic reality of an Instagram-led poll, and it means this is a much better guide to what young India thinks than to what the country as a whole thinks. The oldest bands contain dozens of people, not hundreds.
And this measures perception, not policy. A score of 4.2 says nothing about whether fuel subsidies were sound economics, whether prices moved for reasons within anyone’s control, or what the alternatives would have cost. It says what a large group of mostly young Indians felt about it in a single question, answered on a phone, with their number verified.
That is a narrower thing than a verdict. It is also not nothing — and unlike most numbers in this debate, this one shows its arithmetic.
Source: PolBol Polls, 3,930 OTP-verified responses. Ratings given on a 1–10 scale. Shares are calculated from vote counts and may not total 100% due to rounding. Based on respondent perceptions, not an assessment of policy outcomes.
You May Like This
1



Advertisement
You May Like This




Advertisement
Advertisement
Advertisement