

Advertisement

- Updated on August 26, 2026
- IST 2:57 pm
India rates Patanjali products 5.2 out of 10. Almost exactly the middle of the scale — and one of the least middling distributions in any of these polls.
PolBol’s Hindsight study asked 3,894 OTP-verified respondents a single question: how much would you rate Patanjali products out of 10?
A flat average hiding two crowds
The vote spread tells a more interesting story than the average does.
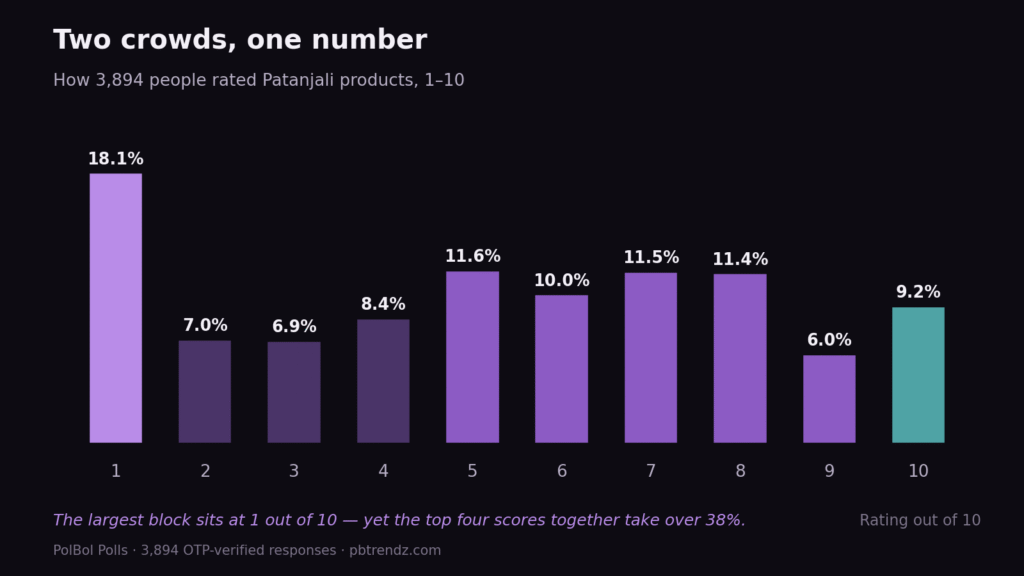
703 people — 18.1 per cent — gave the lowest possible score of 1. It is the single largest block of votes in the study.
But look at the other end. 358 people gave a perfect 10 (9.2 per cent), 234 gave a 9 (6.0 per cent), 445 gave an 8 (11.4 per cent) and 447 gave a 7 (11.5 per cent). Stack those up and the top four scores account for more than 38 per cent of the sample.
Meanwhile the true middle is thin: 6.9 per cent rated it 3, and 7.0 per cent rated it 2.
So 5.2 is not the score of a brand people feel lukewarm about. It is the score of a brand a lot of people rate highly and a substantial minority rate at rock bottom, averaging out to the middle. Two crowds, one number.
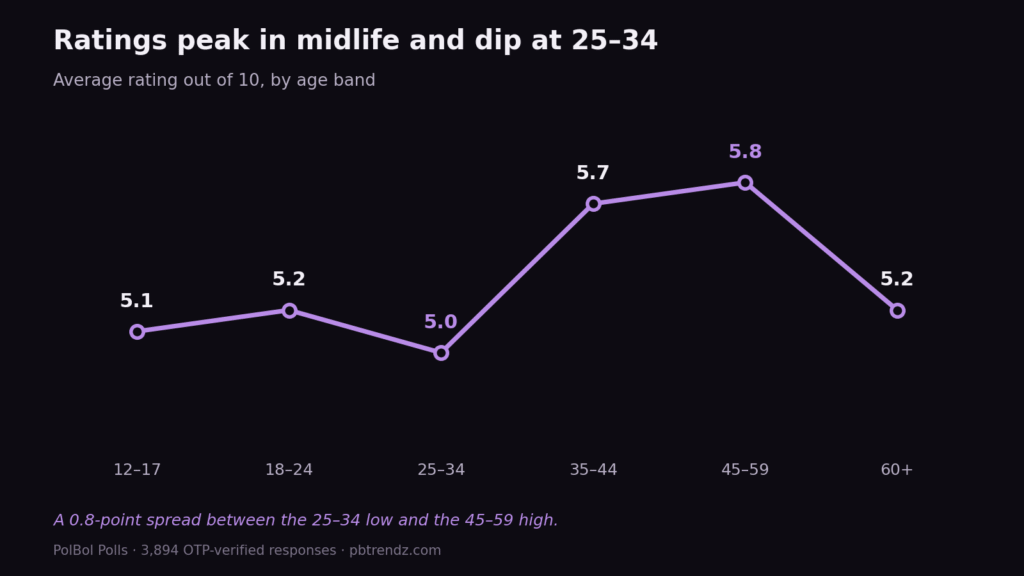
Midlife rates it highest — by a wide margin
Age is where this study gets genuinely useful for anyone trying to understand the brand.
12 to 17-year-olds: 5.1. 19.7 per cent gave a 1.
18 to 24-year-olds: 5.2. The largest group at 2,414 respondents; 18.1 per cent gave a 1.
25 to 34-year-olds: 5.0. The lowest average of any group under 60.
35 to 44-year-olds: 5.7. 55.7 per cent rated it 6 or higher.
45 to 59-year-olds: 5.8. The highest in the poll, with the lowest share of 1-out-of-10 ratings anywhere — 12.8 per cent — and 56.6 per cent rating it 6 or above.
60 and above: 5.2.
The gap between the 25–34 low and the 45–59 high is 0.8 points on a 10-point scale. Both midlife bands clear 5.5 and sit comfortably above the overall average; both younger bands sit below it.
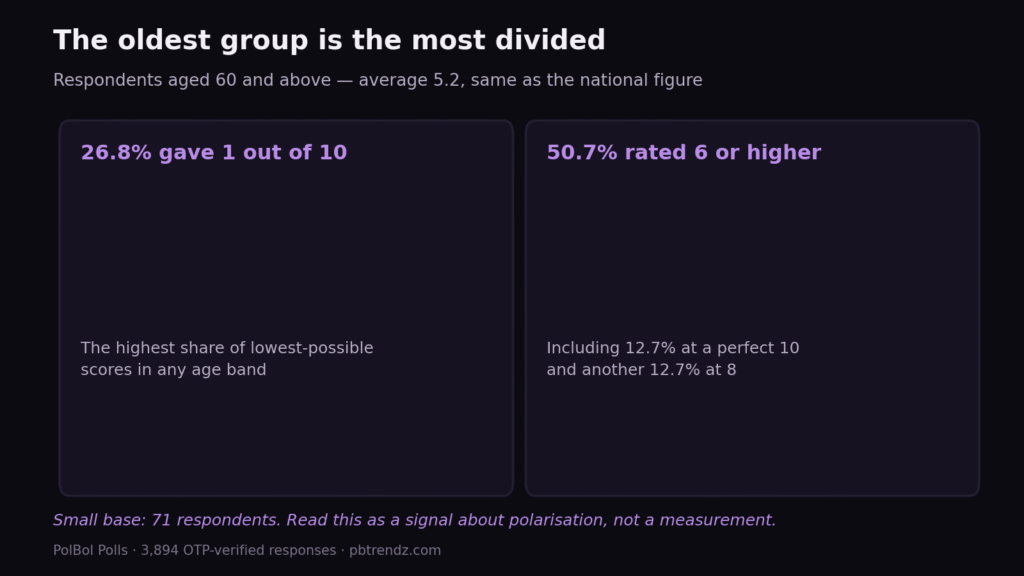
The most divided group is the oldest
Respondents aged 60 and above average 5.2 — identical to the national figure. The spread behind it is not.
This group produced the highest share of 1-out-of-10 ratings of any age band, at 26.8 per cent. And simultaneously, 12.7 per cent gave it a perfect 10 and another 12.7 per cent gave it an 8. In total, 50.7 per cent of them still rated it 6 or higher.
Roughly a quarter at the floor, half above the midpoint. That is not a group with a shared opinion — it is two firm opinions occupying the same age band.
The usual caution applies, and PolBol states it: 71 respondents. Read it as a signal about polarisation rather than a precise measurement.
Men rate it higher — and also hate it more
On averages, the gender gap is almost nothing: men 5.3, women 5.2. At the extremes it is real.
One in five men — 20.0 per cent — gave the lowest score. Among women it was 15.6 per cent.
Women spread out more evenly across the scale: 12.3 per cent rated it 8, and 12.7 per cent rated it 5.
And the widest gender gap in the whole study sits in the 45 to 59 band, where men average 6.2 and women 5.4 — a 0.8-point difference inside a single age group, larger than the gap between any two age groups nationally.
Midlife men are the brand’s strongest constituency in this sample by some distance.
What a 5.2 actually tells you
Brand trackers usually report a score and stop. The value in this one is the shape underneath.
Patanjali’s rating is not soft. It is contested. The people who rate it well are concentrated in midlife and lean male; the people who rate it at 1 are spread across every age band but cluster among younger men and the over-60s. A marketing team reading only “5.2 out of 10” would conclude the brand has an indifference problem. The distribution says it has a polarisation problem, which is a different thing and needs a different answer.
The limits
Two, and they matter.
The sample is young — 18 to 24-year-olds are 62.0 per cent of it. The oldest band has 71 people in it. This is a strong reading of young urban-leaning India and a thin one of everyone else.
And this measures perception, not product. Nobody in this poll tested anything, compared ingredient lists or audited a claim. They gave a number based on what they think and what they have heard. That is a legitimate thing to measure — brands live or die on exactly that — but it is not an assessment of product quality, and PolBol says so on every slide.
Source: PolBol Polls, 3,894 OTP-verified responses. Ratings given on a 1–10 scale. Shares are calculated from vote counts and may not total 100% due to rounding. Based on respondent perceptions, not an assessment of product quality.
You May Like This
1



Advertisement
You May Like This




Advertisement
Advertisement
Advertisement